
Jul
16
2015
How to write copy for infographics
By Jakki Bendell.
Infographics are a way of presenting complex information in a simple, interesting and memorable way. Marketers use them as ‘top of funnel’ pieces to draw attention to issues or encourage readers to do something further, like read a white paper or e-book.
They have grown rapidly in popularity, with the volume of searches increasing 800% in two years. Some of the benefits are that infographics:
- make it easier for people to absorb and engage with your content
- drive targeted traffic to your website – more than ordinary blog posts
- are very sharable on social media, so build brand awareness
- are popular with the media, so can create good quality referrals to your site
OK, so how do I write one?
1. First, identify your goal
Agree what your goal is to help decide what information and format will work best. Your goal could be:
- customer acquisition
- image/brand building
- education
- entertainment
Remember there are two parts to an infographic – content and design. Start with the content (text and data) and then build the design around it, not the other way around.
2. Then identify your target audience
You need to know who you are talking to if your infographic is going to be relevant, interesting and pitched at the right level. Who are they exactly, and what do they care about?
3. Select a relevant topic
Choose a topic that is valuable to your reader – something that they can use (advice, tips) and/or share (something entertaining, surprising, perhaps shocking). Infographics that start a conversation are likely to be shared and attract media interest. Focus on your readers’ interests, as opposed to what you want to talk about.
For inspiration, look at what topics are popular in your niche. Do a search for infographics on Google and Pinterest for your keyword. Explore Twitter and Google trends for trending topics. And check out Digg, Reddit and Buzzfeed for the most popular topics being shared online.
4. Choose an angle or approach
There are endless different ways to feature a topic. Find a single metaphor or story that holds everything together throughout. For a new angle, look at infographics you like well outside of your area of expertise and see if you can adapt their approach for your topic.
Some examples that do well are:
- ‘how to’ guides
- checklist
- omparison
- ‘did you know…?’
- workflow
- overview
5. Do your research
Collect relevant information and data, and check it from different perspectives. Use trustworthy sources and list them at the end to establish credibility.
Enhance internal company information with objective, external data such as academic or industry research, quotes from experts and stats. If the infographic is part of a long-term strategy, make sure the data will still be accurate six months after publication.
6. Create a short, strong headline
Your headline should be short, direct and contain one strong keyword that creates an emotional hook. For example:
- pose an intriguing question – ‘Are you keeping secrets? Evaluate your disclosure policy’
- promise to share useful information – ‘Financing an end to poverty by 2030’
- address the viewer directly – ‘How much is your life worth?’
- use numbers – ’26 time management hacks I wish I’d known at 30’
7. Break the content into blocks
An average user spends a maximum of 3 minutes reading an infographic. Make it easier for them by breaking the content into 5-10 succinct modules with sub-headings. Brevity and clarity is key.
Use the same approach to sub-headings as you did for the main headline to draw your audience into reading the rest of the infographic.
8. End strongly
Write a conclusion and, for impact, finish your infographic with something thought provoking.
9. Make an eye-catching design
The design is to simplify and bring the facts to life. Highlight the key words and numbers. Use illustrations like diagrams and maps to highlight qualitative information. Use charts and graphs for quantitative data.
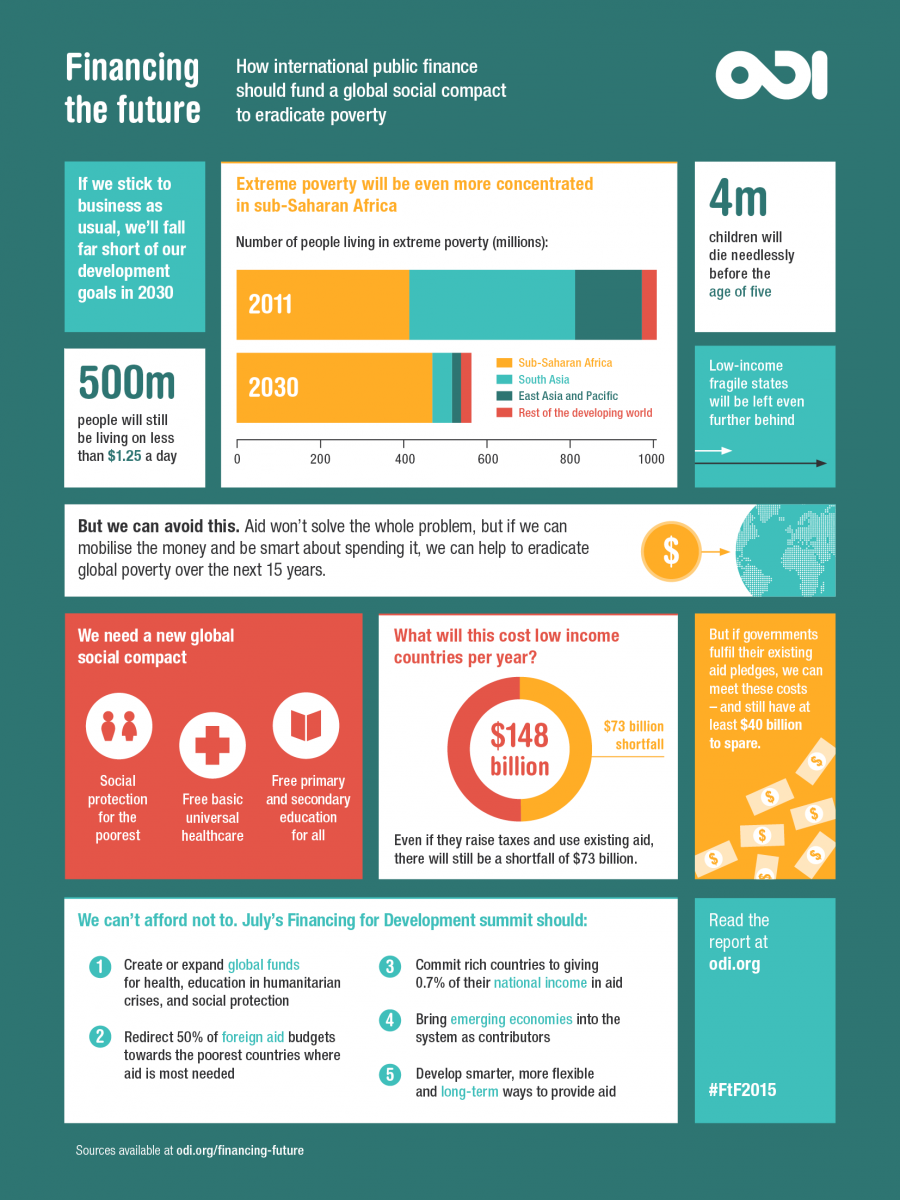
Example of infographic:
Jakki Bendell has over ten years' experience as a consultant, trainer and coach specialising in business writing skills. As a practising professional writer, Jakki draws on a wealth of stories and personal experience to illustrate her courses.